March of the human footprint
The human footprint on Earth is on the move, impacting wildlife, ecosystems, the climate, and human health and welfare on a global scale. Here we show the maps and share the data from a new 20-year analysis of the human footprint. Our analysis indicates that human impacts grew faster in the five years prior to the COVID-19 pandemic than at any other time in the last 12,000 years.
Explore 20 years of human footprint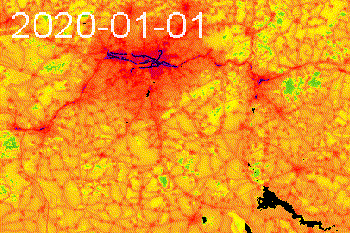
Mapping Human Impacts
The human footprint map is the world’s most widely used metric of human impacts, yet at its core is quite simple in concept. The footprint is a simple weighted sum of maps of where people live (population density), where we build infrastructure (including roads, railways, factories, and other kinds of infrastructure), where we can go (accessibility), and where we use electrical energy, a proxy for access to industrial energy supplies, as measured by the night-time lights. These impacts are mapped at a nominal resolution of 300 meters.
Explore the Maps
The human footprint shows the gradient of human influence, from city centers, through suburbs, past farms and fields, to the least impacted corners of the planet. Higher values indicate greater human impacts, lower values, less impact. Through this website, you can explore the human footprint using our country-level data viewer, access the data for your own analysis, and explore it using Google Earth Engine. To read more about the science behind the human footprint, read our paper here.